
When you open the Chrome web inspector, you can browse to the styles that are being applied to your elements. It’s great.
Unfortunately, if you’re using a framework like LESS or Sass, then by default Chrome will reference the CSS files that those frameworks generate, even if you’ve never seen them before. If you pay attention to these references in the Web Inspector, it can be meaningless at best and outright misleading at worst.
Enter Google Chrome’s native Sass support. This has been available in Canary and Beta channels for a while, but it’s now firmly available in the stable Chrome releases. All you have to do is turn on a few flags and tweak your rails app to make it work. Here’s how.
Enable the right settings in Chrome
First, ensure you have Experiments enabled in Chrome. Open chrome://flags and make sure ‘Enable Developer Tools experiments’ is checked and restart the browser.
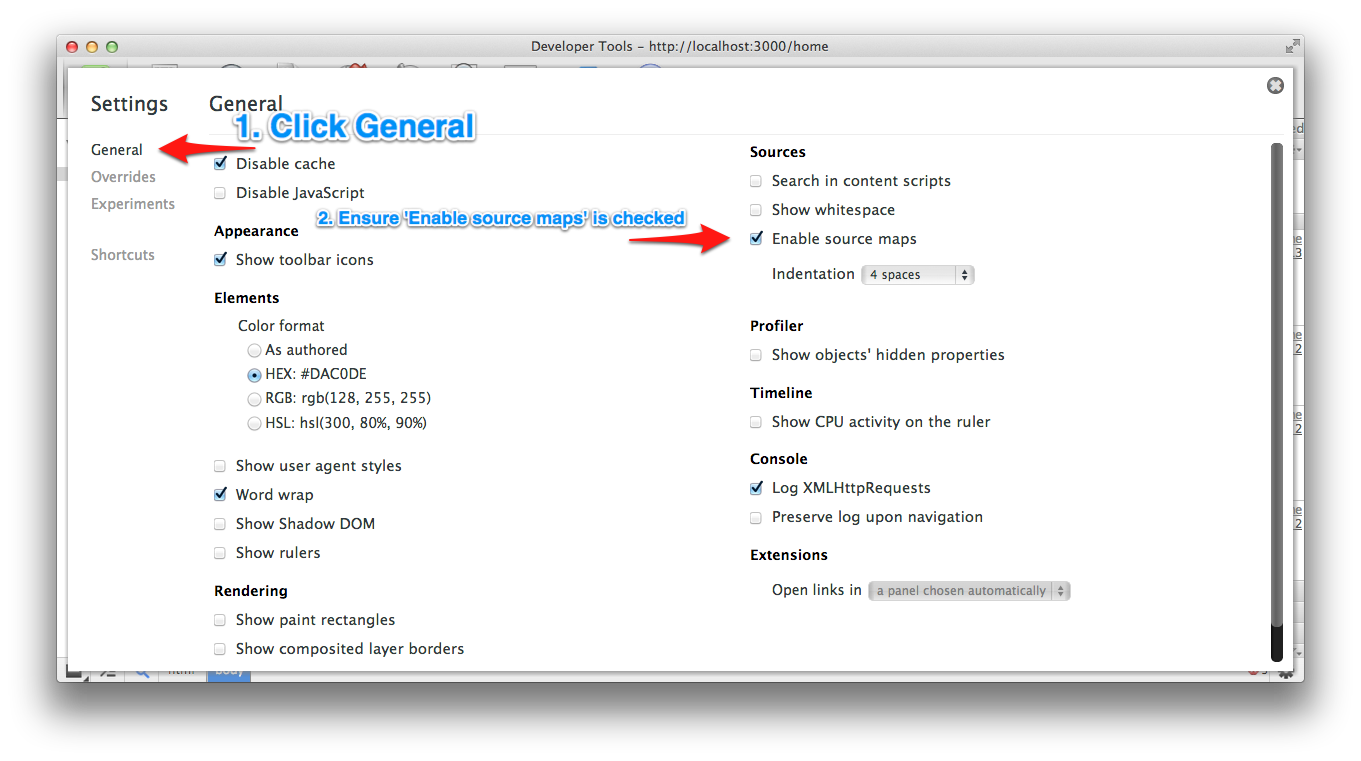
Next, enable support for source maps in Chrome. Open the Web Inspector and then open its settings (by clicking the cog in the bottom right). Ensure you’re looking at the General tab, then check “Enable source maps”:
Next, select the the Experiments tab and check “Support for Sass”:

Close the inspector and restart Chrome for good measure.
Finally, configure your sass compiler to output debug info when compiling. You can enable source map support in your rails 3.1+ webapp by editing config/environments/development.rb and ensuring it contains the following lines:
config.assets.debug = true
config.sass.debug_info = true
config.sass.line_comments = false # source maps don't get output if this is true
Alternatively, if you’re compiling your sass manually, set the :debug_info flag to true and and :line_numbers to false.
You will probably need to delete your generated CSS files to force rails to regenerate the CSS output from your (unchanged) Sass or SCSS files. The cache is typically in Rails.root/tmp/cache or Rails.root/public/assets depending on how you (pre)compile your assets. Remove all of the above with:
RAILS_ENV=development rake assets:clean
Restart your rails server, reload the page in Chrome and inspect the elements: if everything worked you should see references to your .scss or .sass files next to the style blocks in the inspector (see below).
 If you run into any problems or have ideas for how this support could be improved further, please leave a comment below.
Follow @LeeMallabone to see future front-end development tips and tricks.

This is quite helpful. Thanks for the quick tip!
Just a quick note that the ‘Experiments’ tab under the developer console will not show up unless you specifically enable it under chrome://flags (Enable Developer Tools experiments)
I must have done that so long ago I forgot it was important! I’ve updated the post, thanks loads for the correction.
I believe you can use rake assets:clean to remove the precompiled assets…
Nice tip, thanks! I’ve updated the post to mention that.
Support for full property/value/selector mapping has now landed in Chrome. This is about 10x more powerful than the line number mapping that’s in there now.
You’ll want to be exporting the full sass source map for this. See http://snugug.com/musings/debugging-sass-source-maps for more details (2nd half of the post)
This support looks outstanding, thanks for the link, can’t wait to give it a try.
Is there a trick to making the “Experiments” tab show up in Inspector Settings?
chrome://flags/
Then find on page for “Enable Developer Tools experiments.” and turn on (and restart Chrome).
If using CodeKit to compile SASS, you can also select ‘Full debug info’ in the output preferences (for file or globally) in the ‘Debug Info in CSS’ section.
This only works if you change the preferences for the file, global changes don’t affect files you’re already working on it seems.
Thanks for this, didn’t know about the Chrome support! To enable the same in Compass, put this in config.rb:
sass_options = {:debug_info => true}
Thank you – I was hunting for settings for Compass. Looking forward to editing my SASS in the browser!
Pingback: Line Number Mapping for Sass in Chrom Dev Tools | CSS MINE
For those of you using LiveReload, here’s how you can use it:
1. Go to your “monitored folder,” make sure “Compile SASS…” is checked and click “Options.”
2. Check “Emit debug info for FireSass” and make sure “Compact output style” is selected, otherwise it doesn’t work.
Any idea if using MAMP alongside LiveReload prevents this from working correctly? All I’m getting is “localhost:{line-number}” for output.
Great! Could someone help how to do the last part (configure your sass compiler to output debug info when compiling) with codekit?
Select the scss file (sass) in CodeKit, change Debug Info in CSS (in right sidebar) to Full Debug Info. Restart browser…
Awesome thanks Niek!
where do you add this code “config.assets.debug = true …” when using hammer to compile sass?
Pingback: Debugging SASS in Chrome | Daniel Koskinen
Another awesome tool in my Web Design arsenal, thanks!
To map your Firefox to your Sass/SCSS from your CSS file(s), follow these steps:
1. Install Firebug for Firefox: https://addons.mozilla.org/en-us/firefox/addon/firebug/?src=search
2. Install FireSass for Firebug: https://addons.mozilla.org/en-us/firefox/addon/firesass-for-firebug/
3. On your CMD (Command) you need to type the following flag: “–debug-info”. For example: “sass –watch scss:css –compass –debug-info” — No quotes of course
4. Open Firebug (F12) and inspect an element, you’ll see on the Style panel on the right the map of that element on your Sass/SCSS file.
Your CSS file gets ‘injected’ with bunch of extra code*, this extra code is what FireSass (and now Google Chrome) sees, it helps FireSass and Chrome “map” your Sass/SCSS file(s) from your CSS file(s).
*The extra code makes your CSS files quite larger than it needs to be, so make sure you remove the “–debug-info” flag and recompile your final CSS file without it.
Good luck.
Correction: You have to use 2 dashes instead of one in Step 3: “––”
Seems this post system interprets double dashes as em dashes.
Thanks much. Just getting into SASS, and this is extremely helpful.
Pingback: Responsive Design Weekly #50
It really is a very useful function.
If you are windows user or linux user, you can try koala http://koala-app.com/, it support “–debug-info” option too. Hope to help people.
Pingback: Article Roundup for 04.4.13 - Tvenge Design
did someone get it running with the asset pipeline?
we using the @import syntax in the application.css.sass file and not all the time this tree . stuff
thanks for help
Hi Marv,
Make sure you have ‘sass-rails’ in your Gemfile (not just ‘sass’), then the @import stuff should just work: sass-rails hooks into @import to integrate it into sprockets’ tree stuff.
Best,
Lee.
I’m running on the latest Rails 3.2, and Sass 3.2.7. After making the above configuration changes I can see the debug info being spilled into my `application.css` file, but the Web Inspector doesn’t show any SCSS files – just the css.
FWIW: I’m running Chrome 27.0.1453.47 beta.
Hi,
I’ve run into the same problem. Debug info is present in my css file but web instpector still shows me the filenumbers of the css files instead the ones from the scss sources.
Have you found a solution yet?
I’m running Chrome 27.0.1453.116m
I’m seeing this as well, even with a symlink to the folders (I’m using vagrant so I thought that Chrome might be using paths that didn’t exist). I’m starting to wonder whether the SASS (not .scss) syntax is not supported…
A small word of caution: Setting config.sass.debug_info to ‘true’ has taken our build from 5-6 seconds to 25+ seconds. So don’t do this when you’re constantly changing the files.
It seems like chrome 27 has broken this. Just auto-upgraded yesterday and like @stevenharman the web inspector no longer shows .scss files.
FWIW we are running chrome stable 27.0.1453.93
Same here… no SCSS links.
I have the same problem here as well. It was working great but in the latest version of chrome it appears to have stopped working?
Chrome 27 has supports “–sourcemap”, you’re going to need at least SASS 3.3.0.ALPHA.101 for Source Maps to work.
Compile command: sass –watch –sourcemap style.scss:style.css;
That seems to be a widespread issue. Anyone know where to get an older version of Chrome for OSX?
CodeKit uses SASS 3.2.12 rather than 3.3. I guess those of us on Chrome 30.0.1 /CodeKit 1.9.2 are out of luck for awhile?
Pingback: Seeing Sass/SCSS rules in Chrome Inspector – Matt Walters
Because Chrome supports source maps v3 proposal only, I wrote blog post (and gem), how to debug SASS in Rails 4: http://blog.vhyza.eu/blog/2013/09/22/debugging-rails-4-coffeescript-and-sass-source-files-in-google-chrome/
This is great work, thanks!
Thank you, I’m glad if it’s helpful.